> ## Documentation Index
> Fetch the complete documentation index at: https://akshanshgusain.mintlify.site/llms.txt
> Use this file to discover all available pages before exploring further.
# Back of the Envelope Calculation
> How big does each part of my system need to be so it can handle the expected workload with acceptable performance and cost?
In a system‑design interview, “back‑of‑the‑envelope” (BoE) calculations are quick, order‑of‑magnitude estimates that
ground your high‑level architecture in reality. They answer one overarching question:
> “How big does each part of my system need to be so it can handle the expected workload with acceptable performance
> and cost?”
**To do that, you typically estimate five classes of numbers:**
| r | What you estimate | Why it matters | Typical outputs |
| :- | :------------------------ | :---------------------------------------------------------------- | :-------------------------------------------------------------------------------------------- |
| 1 | Traffic volumes | Drives capacity decisions everywhere else | 1. Daily active users (DAU) 2. Requests per second (RPS/QPS) 3. Peak vs. average load factors |
| 2 | Data size & growth | Guides storage engines, sharding strategy, and retention policies | 1. Bytes/row or object 2. Total rows/objects per day 3. Storage after 1year, 3 years |
| 3 | Throughput & bandwidth | Determines network links, replication costs, CDN usage | 1. Ingest MB/s 2. Egress MB/s to clients 3. Replication traffic between DCs |
| 4 | Latency budgets | Shapes caching layers, queue depths, timeouts | 1. Client‑visible SLA (e.g., ‑‑p99 \< 200ms) 2. Per‑hop allocation (frontend, cache, DB) |
| 5 | Hardware / cost footprint | Justifies design trade‑offs and shows business awareness | 1. No. app servers, DB shards, cache nodes 2. Monthly cloud bill rough‑cut |
### How those numbers are used during the interview
1. Validate feasibility
Show that your design can actually handle 10M QPS without a single‑node bottleneck.
2. Justify component choices
• “A Redis cache reduces DB load from 30k to 3k QPS, so we only need 4 DB shards instead of 40.”
• “A CDN cuts egress from origin by 95%, saving≈\$X/month.”
3. Expose trade‑offs
Invite discussion about why you chose SSDs over HDDs, or DynamoDB over PostgreSQL, in light of the numbers.
4. Guide prioritisation
Huge storage growth? Plan for lifecycle policies and cold storage first. Tight latency SLO? Focus on cache and request fan‑out next.
### Typical BoE workflow (2–3min)
1. **Start with the user activity**
“Suppose we have 50M DAU; on an average, each opens the app 5 times/day ⇒ 250M sessions/day …”
2. **Derive peak traffic**
Use a peak/average ratio (often 5–10×). “… peak ≈15k requests/s.”
3. **Compute per‑request data**
Payload, metadata, DB rows touched. “… profile pic upload: 4MB \* 2M/day = 8TB/day.”
4. **Roll up totals and apply headroom**
Add 50%–100% safety margin to anticipate growth and bursts.
5. **Sanity‑check**
Compare numbers with known reference points (Twitter, Instagram) so the interviewer sees you’re calibrated.
### Key interview tips
**Round aggressively** – 1.6TB → “about 2TB”. Precision is less important than reasoning speed.
**Narrate assumptions** – The interviewer can correct unrealistic ones, giving you richer guidance.
**Keep a small “cheat sheet”** of latency reference numbers (L1 cache, SSD read, cross‑DC RTT) to justify claims.
**Use the numbers** – Don’t let them sit on the whiteboard; drive design decisions with them.
[BoE Online Calculator](https://systemdesignschool.io/resource-estimator?dau=1000000\&read_write_ratio=10:1\&write_operations=1\&data_retention=3\&data_per_write_request=10240\&precision_mode=true)
***
## Powers of two table
| Power | Exact Value | Approx Value | Bytes |
| :---- | :---------------- | :----------- | :---- |
| 7 | 128 | | |
| 8 | 256 | | |
| 10 | 1024 | 1 thousand | 1 KB |
| 16 | 65,536 | | 64 KB |
| 20 | 1,048,576 | 1 million | 1 MB |
| 30 | 1,073,741,824 | 1 billion | 1 GB |
| 32 | 4,294,967,296 | | 4 GB |
| 40 | 1,099,511,627,776 | 1 trillion | 1 TB |
## Latency numbers every programmer should know
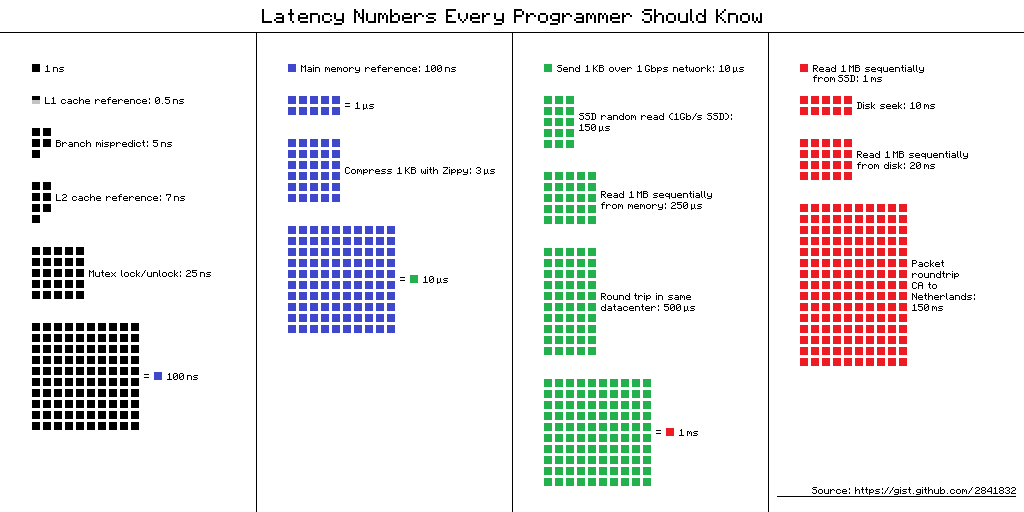 | Operation | Latency (ns) | Latency (us) | Latency (ms) | Notes |
| :------------------------------------- | :----------- | :----------- | :----------- | :-------------------------- |
| L1 cache reference | 0.5 | — | — | |
| Branch mispredict | 5 | — | — | |
| L2 cache reference | 7 | — | — | 14x L1 cache |
| Mutex lock/unlock | 25 | — | — | |
| Main memory reference | 100 | — | — | 20x L2 cache, 200x L1 cache |
| Compress 1K bytes with Zippy | 10,000 | 10 | — | |
| Send 1 KB over 1 Gbps network | 10,000 | 10 | — | |
| Read 4 KB randomly from SSD\* | 150,000 | 150 | — | \~1GB/sec SSD |
| Read 1 MB sequentially from memory | 250,000 | 250 | — | |
| Round trip within same datacenter | 500,000 | 500 | — | |
| Read 1 MB sequentially from SSD\* | 1,000,000 | 1,000 | 1 | \~1GB/sec SSD, 4X memory |
| HDD seek | 10,000,000 | 10,000 | 10 | 20x datacenter roundtrip |
| Read 1 MB sequentially from 1 Gbps net | 10,000,000 | 10,000 | 10 | 40x memory, 10X SSD |
| Read 1 MB sequentially from HDD | 30,000,000 | 30,000 | 30 | 120x memory, 30X SSD |
| Send packet CA → Netherlands → CA | 150,000,000 | 150,000 | 150 | |
### Notes
* 1 ns = 10⁻⁹ seconds
* 1 µs = 10⁻⁶ seconds = 1,000 ns
* 1 ms = 10⁻³ seconds = 1,000 µs = 1,000,000 ns
**Handy metrics based on the numbers above:**
* Read sequentially from HDD at 30 MB/s
* Read sequentially from 1 Gbps Ethernet at 100 MB/s
* Read sequentially from SSD at 1 GB/s
* Read sequentially from the main memory at 4 GB/s
* 6–7 worldwide round trips per second
* 2,000 round trips per second within a data center
## Availability numbers
High availability is the ability of a system to be continuously operational for a desirably long period of time. High availability is measured as a percentage, with 100% means a service that has 0 downtime. Most services fall between 99% and 100%.
A service level agreement (SLA) is a commonly used term for service providers. This is an agreement between you (the service provider) and your customer, and this agreement formally defines the level of uptime your service will deliver. Cloud providers Amazon \[4], Google \[5] and Microsoft \[6] set their SLAs at 99.9% or above. Uptime is traditionally measured in nines. The more the nines, the better. As shown in Table 3, the number of nines correlate to the expected system downtime.
| Availability % | Downtime per day | Downtime per week | Downtime per month | Downtime per year |
| :------------- | :------------------ | :---------------- | :----------------- | :---------------- |
| 99% | 14.40 minutes | 1.68 hours | 7.31 hours | 3.65 days |
| 99.99% | 8.64 seconds | 1.01 minutes | 4.38 minutes | 52.60 minutes |
| 99.999% | 864.00 milliseconds | 6.05 seconds | 26.30 seconds | 5.26 minutes |
| 99.9999% | 86.40 milliseconds | 604.80 | 2.63 seconds | 31.56 seconds |
## Example: Estimate Twitter QPS and storage requirements
Please note the following numbers are for this exercise only as they are not real numbers from Twitter.
**Assumptions:**
* 300 million monthly active users.
* 50% of users use Twitter daily.
* Users post 2 tweets per day on average.
* 10% of tweets contain media.
* Data is stored for 5 years.
**Estimations:**
**Query per second (QPS) estimate:**
* Daily active users (DAU) = 300 million \* 50% = 150 million
* Tweets QPS = 150 million \* 2 tweets / 24 hour / 3600 seconds = \~3500
* Peek QPS = 2 \* QPS = \~7000
**We will only estimate media storage here.**
* Average tweet size:
* tweet\_id 64 bytes
* text 140 bytes
* media 1 MB
* Media storage: 150 million \* 2 \* 10% \* 1 MB = 30 TB per day
* 5-year media storage: 30 TB \* 365 \* 5 = \~55 PB
### Tips
Back-of-the-envelope estimation is all about the process. Solving the problem is more important than obtaining results. Interviewers may test your problem-solving skills. Here are a few tips to follow:
Rounding and Approximation. It is difficult to perform complicated math operations during the interview. For example, what is the result of “99987 / 9.1”? There is no need to spend valuable time to solve complicated math problems. Precision is not expected. Use round numbers and approximation to your advantage. The division question can be simplified as follows: “100,000 / 10”.
Write down your assumptions. It is a good idea to write down your assumptions to be referenced later.
Label your units. When you write down “5”, does it mean 5 KB or 5 MB? You might confuse yourself with this. Write down the units because “5 MB” helps to remove ambiguity.
Commonly asked back-of-the-envelope estimations: QPS, peak QPS, storage, cache, number of servers, etc. You can practice these calculations when preparing for an interview. Practice makes perfect.
## Source(s) and further reading
* [Latency numbers every programmer should know - 1](https://gist.github.com/jboner/2841832)
* [Latency numbers every programmer should know - 2](https://gist.github.com/hellerbarde/2843375)
* [Designs, lessons, and advice from building large distributed systems](https://www.cs.cornell.edu/projects/ladis2009/talks/dean-keynote-ladis2009.pdf)
* [Software Engineering Advice from Building Large-Scale Distributed Systems](https://static.googleusercontent.com/media/research.google.com/en//people/jeff/stanford-295-talk.pdf)
| Operation | Latency (ns) | Latency (us) | Latency (ms) | Notes |
| :------------------------------------- | :----------- | :----------- | :----------- | :-------------------------- |
| L1 cache reference | 0.5 | — | — | |
| Branch mispredict | 5 | — | — | |
| L2 cache reference | 7 | — | — | 14x L1 cache |
| Mutex lock/unlock | 25 | — | — | |
| Main memory reference | 100 | — | — | 20x L2 cache, 200x L1 cache |
| Compress 1K bytes with Zippy | 10,000 | 10 | — | |
| Send 1 KB over 1 Gbps network | 10,000 | 10 | — | |
| Read 4 KB randomly from SSD\* | 150,000 | 150 | — | \~1GB/sec SSD |
| Read 1 MB sequentially from memory | 250,000 | 250 | — | |
| Round trip within same datacenter | 500,000 | 500 | — | |
| Read 1 MB sequentially from SSD\* | 1,000,000 | 1,000 | 1 | \~1GB/sec SSD, 4X memory |
| HDD seek | 10,000,000 | 10,000 | 10 | 20x datacenter roundtrip |
| Read 1 MB sequentially from 1 Gbps net | 10,000,000 | 10,000 | 10 | 40x memory, 10X SSD |
| Read 1 MB sequentially from HDD | 30,000,000 | 30,000 | 30 | 120x memory, 30X SSD |
| Send packet CA → Netherlands → CA | 150,000,000 | 150,000 | 150 | |
### Notes
* 1 ns = 10⁻⁹ seconds
* 1 µs = 10⁻⁶ seconds = 1,000 ns
* 1 ms = 10⁻³ seconds = 1,000 µs = 1,000,000 ns
**Handy metrics based on the numbers above:**
* Read sequentially from HDD at 30 MB/s
* Read sequentially from 1 Gbps Ethernet at 100 MB/s
* Read sequentially from SSD at 1 GB/s
* Read sequentially from the main memory at 4 GB/s
* 6–7 worldwide round trips per second
* 2,000 round trips per second within a data center
## Availability numbers
High availability is the ability of a system to be continuously operational for a desirably long period of time. High availability is measured as a percentage, with 100% means a service that has 0 downtime. Most services fall between 99% and 100%.
A service level agreement (SLA) is a commonly used term for service providers. This is an agreement between you (the service provider) and your customer, and this agreement formally defines the level of uptime your service will deliver. Cloud providers Amazon \[4], Google \[5] and Microsoft \[6] set their SLAs at 99.9% or above. Uptime is traditionally measured in nines. The more the nines, the better. As shown in Table 3, the number of nines correlate to the expected system downtime.
| Availability % | Downtime per day | Downtime per week | Downtime per month | Downtime per year |
| :------------- | :------------------ | :---------------- | :----------------- | :---------------- |
| 99% | 14.40 minutes | 1.68 hours | 7.31 hours | 3.65 days |
| 99.99% | 8.64 seconds | 1.01 minutes | 4.38 minutes | 52.60 minutes |
| 99.999% | 864.00 milliseconds | 6.05 seconds | 26.30 seconds | 5.26 minutes |
| 99.9999% | 86.40 milliseconds | 604.80 | 2.63 seconds | 31.56 seconds |
## Example: Estimate Twitter QPS and storage requirements
Please note the following numbers are for this exercise only as they are not real numbers from Twitter.
**Assumptions:**
* 300 million monthly active users.
* 50% of users use Twitter daily.
* Users post 2 tweets per day on average.
* 10% of tweets contain media.
* Data is stored for 5 years.
**Estimations:**
**Query per second (QPS) estimate:**
* Daily active users (DAU) = 300 million \* 50% = 150 million
* Tweets QPS = 150 million \* 2 tweets / 24 hour / 3600 seconds = \~3500
* Peek QPS = 2 \* QPS = \~7000
**We will only estimate media storage here.**
* Average tweet size:
* tweet\_id 64 bytes
* text 140 bytes
* media 1 MB
* Media storage: 150 million \* 2 \* 10% \* 1 MB = 30 TB per day
* 5-year media storage: 30 TB \* 365 \* 5 = \~55 PB
### Tips
Back-of-the-envelope estimation is all about the process. Solving the problem is more important than obtaining results. Interviewers may test your problem-solving skills. Here are a few tips to follow:
Rounding and Approximation. It is difficult to perform complicated math operations during the interview. For example, what is the result of “99987 / 9.1”? There is no need to spend valuable time to solve complicated math problems. Precision is not expected. Use round numbers and approximation to your advantage. The division question can be simplified as follows: “100,000 / 10”.
Write down your assumptions. It is a good idea to write down your assumptions to be referenced later.
Label your units. When you write down “5”, does it mean 5 KB or 5 MB? You might confuse yourself with this. Write down the units because “5 MB” helps to remove ambiguity.
Commonly asked back-of-the-envelope estimations: QPS, peak QPS, storage, cache, number of servers, etc. You can practice these calculations when preparing for an interview. Practice makes perfect.
## Source(s) and further reading
* [Latency numbers every programmer should know - 1](https://gist.github.com/jboner/2841832)
* [Latency numbers every programmer should know - 2](https://gist.github.com/hellerbarde/2843375)
* [Designs, lessons, and advice from building large distributed systems](https://www.cs.cornell.edu/projects/ladis2009/talks/dean-keynote-ladis2009.pdf)
* [Software Engineering Advice from Building Large-Scale Distributed Systems](https://static.googleusercontent.com/media/research.google.com/en//people/jeff/stanford-295-talk.pdf)